View image
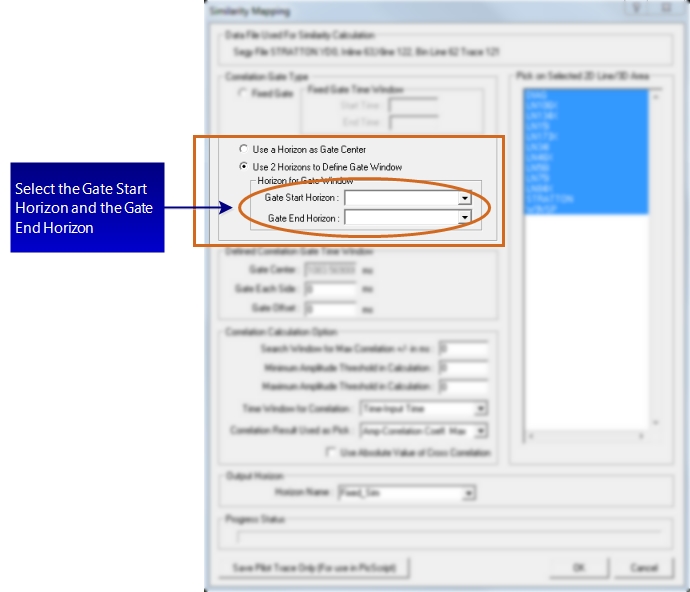
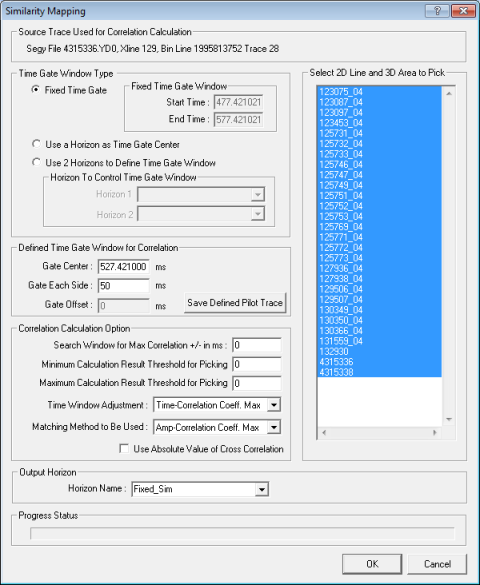
How to open the similarity mapping dialog box
Similarity maps compare a pilot trace to other traces on 2D and 3D datasets in your project. They are useful as quick look reconnaissance tools for rapidly high-grading the areas of interest in your seismic data. You will typically use cross-correlation coefficients as the principal comparison technique when creating a similarity map, but you can use several other comparison techniques. You can summarize your results using ranking maps.
Follow these steps to create a similarity map:
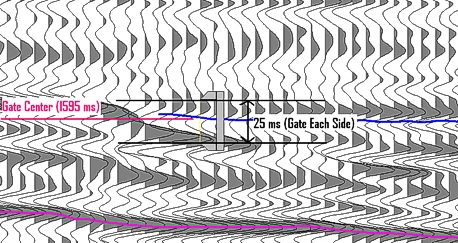
Use a Horizon as Time Gate Center
Use 2 Horizons to Define Time Gate Window
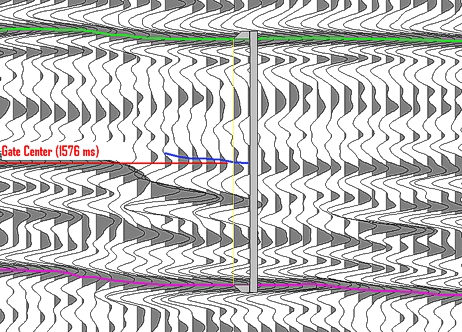
- Gate Center - Type the value (in milliseconds) for the time to center the gate on.
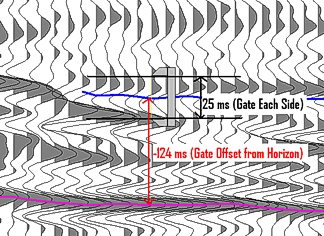
- Gate Each Side - Type the value for the time to use as a window above and below the gate center.
- Gate Offset - Type the value for the time to use to offset the gate center.
- Search Window for Max Correlation +/- in ms - Type a value to define how many milliseconds to allow time zero to shift when looking for the maximum correlation.
- Minimum Calculation Result Threshold for Picking - Type a minimum threshold to filter your results for the amplitude field.
- Maximum Calculation Result Threshold for Picking - Type a maximum threshold to filter your results for the amplitude field.
- If you type 100 for the Minimum Threshold and 200 for the Maximum Threshold, ProductName will output only amplitude values between 100 and 200. All values outside that range will not be picked. If you select Minimum Threshold and Maximum Threshold values of 0, then all values will be output.
- Time Window Adjustment - You have three options in this list:
List Option Description Time-Correlation Coeff. Max Select this option if you want ProductName to calculate the time when the maximum cross-correlation value is found. This maximum value is measured from time zero of the seismic data set. Time-Envelope Max Select this option if you want ProductName to calculate the time when the maximum cross-correlation envelope is found. The maximum envelope is the time at which you would get the best tie if the seismic trace were phase adjusted to the plot. Time-Input Time These windows display the start and end time for fixed gate data, as determined by your selections in this dialog box. These windows only appear if you selected Fixed Gate as your gate location.
- Matching Method to be Used - Select from the list of methods you can use to generate your correlation.
- Use Absolute Value of Cross Correlation - Select this check box to have ProductName consider negative and positive values to be equal.
 .
.