Open topic with navigation
Create a Ranking Map
 View image

 How to open
On the menu bar, select Horizon.
Ranking maps are used to compare two or more similarity
maps according to their cross correlation values. On each trace, the
map with the largest correlation coefficient is selected. The final result
is capable of highlighting such characteristics as facies and thickness
distributions. Follow these steps:
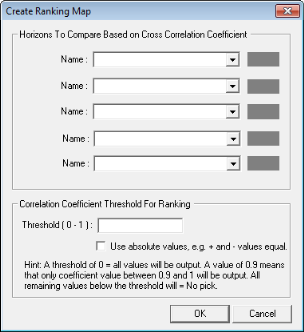
- Use the drop-down lists to select two or more
similarity maps to compare.
- To change the color for each map, double-click
on the color tab next to each map and select a new color.
- Specify a threshold amplitude value below which no rank
will be assigned.
- A threshold value of 0 = all values will be output. A value of 0.9 means
that only amplitude values between 0.9 and 1 will be output. All remaining values
below the threshold will = No pick
- If you want WinPICS to consider negative and positive values equal, select the Use Absolute
Values box.
- Click <OK> to create the ranking map.
The ranking map will display which map has the largest cross correlation
coefficient on each seismic trace or grid node.
What do you want to do?
 View image