Open topic with navigation
Change, Display, or Select Max Value
 View image

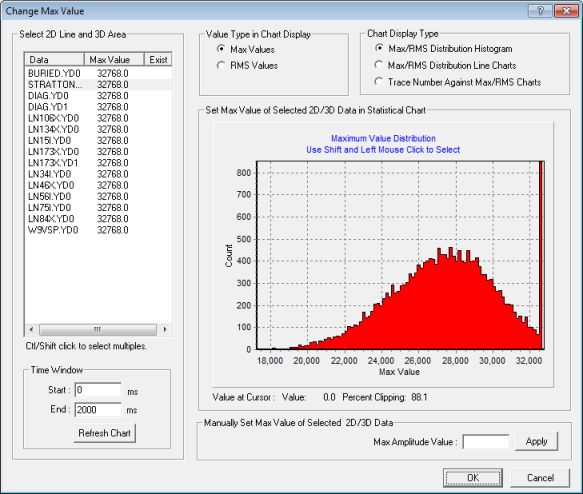
Use this dialog box to set the maximum value for float data. It appears in three different work-flows, and the name in the title bar changes depending on which of these you are working in. However, the options in the dialog box are the same.
how to open the dialog box
 Change maximum value
On the Application toolbar, select .
 Display maximum value stats
On the Application toolbar, select .
 Select maximum value for import
When you reach the Set Max Value stage of the import, click <Chart
Max Values>.
Work in the dialog box
This dialog box displays a chart of amplitude
values. Follow these steps to change and view the amplitude data.
- In the Value Type in Chart Display
section, choose Max Values
(largest amplitude for each trace) or RMS Values.
- In the Chart
Display Type section, choose whether you want to view a Max/RMS Distribution Histogram,
a Max/RMS Distribution Line Charts,
or a Trace Number Against Max/RMS
chart.
- In the chart window, view the data you are working with.
- If you are importing lines into your project that are similar to lines
already in your project, you will want to make sure that you clip the
new data at the same point as the existing data. This will ensure you
can tie the data together or that you maintain the same relative amplitudes.
Select the Display Previously Loaded
Data check box to also view the information about your project's
current lines.
- To set your max value, hold the <Shift>
key on your keyboard and click on the chart to set the value. Alternatively,
if you know the value number, type that information in the Max Amplitude Value field and click <Apply>.
- Click <OK>.
What do you want to do?
 View image
 Select maximum value for import