Open topic with navigation
Display
Option - Correlation Window
 View image

 How to open the display correlation options window
- Open the Tie with Diagnostics dialog box.
- Click on the Correlation tab.
- Click <Correlation Window Display Option>.
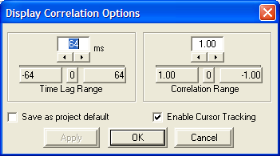
Use the Display Correlation Options dialog box to change axis ranges or enable cursor tracking for the correlation in your spectral analysis.
You have the following options:
- Time
Lag Range: Enter a time lag range between 0 and 1024 ms for the x-axis.
- Correlation
Range: Enter a correlation range between 0 and 1 for the y-axis.
- Save as Project Default - Select this check box to save the axis ranges displayed above as the defaults for every fence tie in this project.
- Enable Cursor
Tracking: Select this check box to display cross-hairs
on the cross-correlation plot. This is useful for determining values at
specific point on the cross-correlation plot. Cursor tracking can also
be enable by left clicking on the cross-correlation graphic. Left click
again to turn cursor tracking off.
- <Apply> - Click to apply changes in the plot. You can see your new plot in the Tie with Diagnostics dialog box.
- <OK> - Click to apply changes and close the Display Correlation Options dialog box.
- <Cancel> - Click to exit without saving changes.
- You can also open the Display Correlation Options dialog box by right clicking on the cross-correlation graphic in the Spectral Analysis dialog box and selecting
from the popup menu.
What do you want to do?
 View image
 How to open the display correlation options window