Open topic with navigation
Gains Tab
Use the Gains
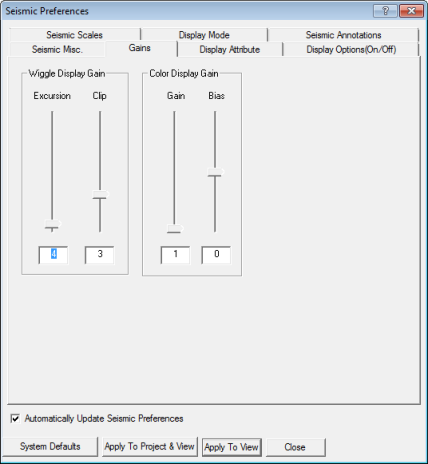
tab to increase or decrease the seismic gain for display in the Seismic
view.  View image

You can adjust wiggle gain for excursion or clip. You can also adjust
color gain for gain or bias. Adjust these parameters by moving the slider
bars up and down. WinPICS updates
the Seismic
window dynamically. You can also adjust the gain by typing values into
the text boxes and then clicking <Apply>.
- Wiggle Excursion
- Applies a scalar to the trace amplitude. For example, a setting of 4 displays the maximum amplitude of
the entire dataset at an excursion of two traces on either side of zero
amplitude. Increase the wiggle excursion to increase the trace amplitude,
and vice versa.
- Wiggle Clip
- Sets a range of amplitudes to display in your seismic. WinPICS
clips (excludes) any amplitudes higher, in either direction, than the
number of traces specified in the Clip
field. For example, if the wiggle clip is set to 3,
then all amplitudes that fall beyond three traces in either direction
are excluded from the seismic. Clipped amplitudes appear squared off.
If your data appears clipped, increase the wiggle clip or decrease the
wiggle excursion.
- Color Gain
- Applies a scalar to your data range on the color palette so that
colors are focused on a smaller or larger data range than the default.
For example, if the data range on your color palette is –32 800 to +32
800, and you change the color gain from 1 to 2, then your new data range
will be –16 400 to +16 400, and all values greater than 16 400 will be
displayed as 16 400.
- Color Bias
- Shifts the color mapping around the zero point. This is useful
for one-sided data which contains all positive or negative values. Enter
a number between –0.5 and +0.5. Zero is the default and means that colors
are distributed about the zero data value. Apply a color bias to shift
the data range so that colors are distributed about a value other than
zero. For example, if you have a color range of –32 800 to 32 800 and
enter a color bias of -0.5, the new color range will be 0 to 65 500. A
setting of 0.5 would shift the color range to –65 000 to 0.
- Display gain
is a temporary setting. Use the Amplitude
Scale Factor to make adjustments that can be saved with your data
file for display, plotting, and export.
What do you want to do?
 View image
 View image