Open topic with navigation
Display
Option - Power Spectrum Window
 View image

 How to open the display option for power spectrum window
- Open the Tie with Diagnostics dialog box.
- Click on the Power Spectrum tab.
- Click <Power Window Display Option>.
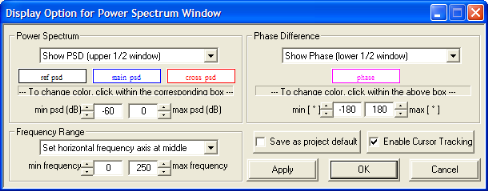
Use the Display Option for Power Spectrum Window dialog box to change curve positions, curve colors, and axis ranges, or to enable
cursor tracking in your spectral analysis.
Power Spectrum Display Options
- Change the position of the power spectrum by clicking
on the arrow under Power Spectrum
and selecting Show PSD (full window),
Show PSD (upper ½ of window),
or Show PSD (lower ½ of window).
- Change the color of the power spectrum for each
curve by left clicking on ref psd for the reference seismic power spectrum, main
psd for the active seismic line, or cross
psd for the cross-correlation power spectrum. Select a color and
click on OK.
- Enter a power range for the y-axis under min psd (dB) and max
psd (dB). Click Apply to view changes.
Frequency Range Display Options
- Change the position of the frequency axis on the
power and phase spectra by clicking on the arrow under Frequency
Range and selecting Set horizontal
frequency axis at bottom, Set
horizontal frequency axis at middle, or Set
horizontal frequency axis at top.
- Enter a frequency range for the x-axis under min frequency and max
frequency. Click Apply to view changes.
Phase Spectrum Display Options
- Change the position of the phase spectrum by clicking on the arrow under Phase Difference and selecting Show
Phase (full window), Show Phase
(upper ½ of window), Show Phase
(lower ½ of window), or Do Not
Show Phase.
- Change the color of the phase spectrum by left
clicking on phase. Select a color
and click <OK>.
- Enter a phase range for the y-axis under min phase (deg) and max
phase (deg). Click Apply to view changes.
Cursor Tracking
Select the EnableCursor Tracking check box to display cross-hairs
on the power and phase spectra. This is useful for determining values at specific point on the plot. Cursor tracking can also be enable by left
clicking on the graphic. Left click again to turn cursor tracking off.
Click <OK> to accept changes and
exit window, or click <Cancel> to
exit without saving changes.
- You can also open the display options window
by right clicking on the graphic and selecting from the popup menu.
What do you want to do?
 View image
 How to open the display option for power spectrum window