Open topic with navigation
Display
Option - Wavelet Matching Window
 View image

 How to open the display option for transfer function window
- Open the Tie with Diagnostics dialog box.
- Click on the Wavelet Matching/ Transfer Function tab
- Click <Wavelet Window Display Option>.
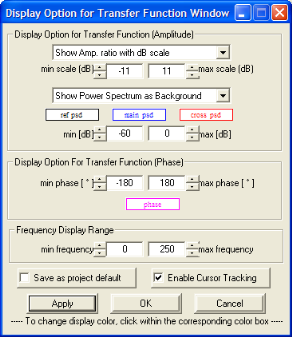
Use the Display Option for Transfer Function Window dialog box to change curve positions, curve colors, and axis ranges, or to enable cursor tracking in the Wavelet Matching/Transfer Function Design dialog box.
Display Options for the Amplitude Spectrum
- Change the scale for the amplitude ratio plot
by clicking on the arrow at the top of the window directly under Display Option for Transfer Function (Amplitude)
and selecting Show Amp. ratio with dB
scale or Show Amp. ratio with
linear scale.
- Enter a range for the amplitude ratio (y-axis)
under min scale (dB) and max scale (dB).
- Change the position of the power spectrum (in
the background) by clicking on the arrow under Power
Spectrum and selecting Show PSD
(full window), Show PSD (upper
½ of window), Show PSD (lower
½ of window), or Do Not Show Power
Spectrum.
- Change the color of the power spectrum by left clicking cross psd. Select a color
and click on <OK>.
- Enter a range for the power spectrum (y-axis)
under min (dB) and max
(dB). Click <Apply> to view
changes.
Display Options for the Phase Spectrum
- Enter a phase range for the y-axis under min phase (deg) and max
phase (deg). Click<Apply> to
view changes.
- Change the color of the phase spectrum by left
clicking on phase. Select a color and click on <OK>.
Display Options for the Frequency Axis
- Enter a frequency range for the x-axis under min frequency and max
frequency. Click <Apply> to
view changes.
What do you want to do?
 View image
 How to open the display option for transfer function window