Open topic with navigation
How to Draw Time Slice Pies
Use time slice mode to compare the wells in your query results, by time.
How time slices differ from bubble maps
While bubble mapping gives you an overview of the whole production period,
time slice bubbles and pies give you an overview of parameters
in a time period as specific as one month in a chosen year. Also, you
can use time slice pies to compare more than one type of parameter.
- Before you can draw time slice bubbles or pies, you must first create
a result list. While you can use bubble mapping with just a map area zoom,
with time slice, you must have a results list to choose from.
Workflow to create a time slice pie
- Create a new query.
- From the Bubble Map/Time Slice Tools
toolbar, click
 to switch to time slice mode.
- On the same toolbar, click
 to open
the Time
Slice Property Page dialog box.
to open
the Time
Slice Property Page dialog box.
- Click the Pie Property
tab.
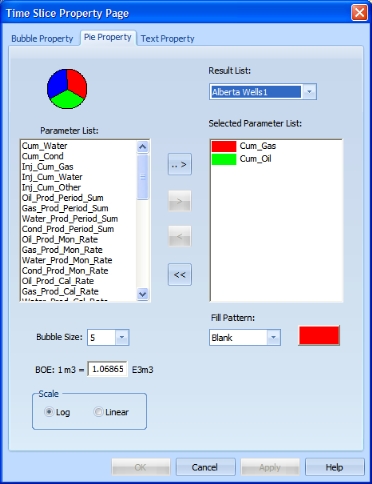
- In the Parameter
List window, select a parameter you want to add to your pie.
- Click <>>
to move your selection to the Selected
Parameter List window.
- In the Parameter
List, select another option, then press and hold <CTRL> on
your keyboard and select the second option.
- Release the <CTRL> key.
- Click <.. >>
to move your selections to the Selected
Parameter List window.
- Click <OK>
to draw pies using the default bubble size and scale. GeoVista automatically assigns
colors to each parameter. Read More
What do you want to do?