View image
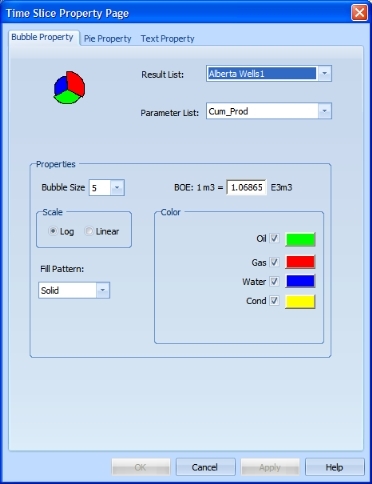
How to open the time slice property page dialog box
Use the Time Slice Property Page dialog box to post text labels, draw time slice bubbles, or draw time slice pies, for a specific time period of your result list.
These time slice bubbles and pies give you an overview for a specific time period, rather than a summary of the whole production period. For example, if you want to analyze a result list for the year 2006, then enter 2006 in the Year box on the Bubble Map/Time Slice Tools toolbar. GeoVista will draw time slice bubbles or pies for that time period alone.
| Tab | When You Would Select It |
|---|---|
| Bubble Property |
To add a bubble graph to your map that displays one type of information in your wells, such as a summary of their production period. |
| Pie Property |
To add a pie graph to your map that displays a comparison of multiple types of information in your wells, to see how the quantities change over time. |
| Text Property |
To display your time slice information as text labels in the map. Choose this option if you're only interested in seeing the data, and you do not want to see the differences represented by either a time slice bubble or a pie. |
What do you want to do?