Open topic with navigation
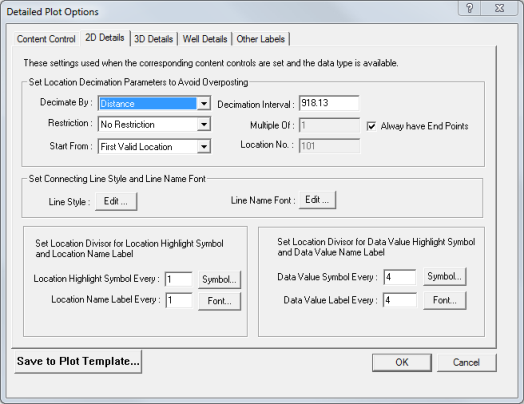
Detailed Plot Options for 2D Details
 View image
How to open the 2D details tab
- On the menu bar, select or
 to open the Print Map dialog box.
- Click the <...> button beside Edit or View Detailed Plot Settings to open the Detailed Plot Options dialog box.
- Click on the 2D Details tab.
set 2D seismic line options for your map plot
Define Seismic 2D Line Point and Print Point Connector
The options in this section control the 2D line decimation.
- Decimate By - Select to decimate 2D lines by trace, shotpoint, or distance.
- Decimation Interval - Type a value for the interval between traces. Read more.
For example, if you select to decimate by Distance and enter a decimation factor of 50, then ProductName selects a trace approximately every 50m. If you select to decimate by Trace and enter a decimation factor of 2, then ProductName selects every second trace.
- Restriction - Select how to define valid numbers for your decimation results. Read more.
Your choices are:
| No Restriction |
|
| Only Integer Locations |
Prevents numbers such as 99.5, 103.5, etc. |
| Only Locations Multiple Of |
Allows locations that are multiples of values entered in Multiple Of. |
Continuing from the example shown for Decimation Factor, if you select Only Integer Locations, then ProductName will select the closest trace to 50m that is an integer. If you only select locations that are a multiple of 5, then ProductName will only select traces that are closest to the 50m and are a multiple of 5.
- Multiple Of - If you select Only Locations Multiple Of for your restriction, then you need to type the multiple value into this field.
- Always have End Points - Select this check box if you want ProductName to accept the first and last traces even if they do not fall within the output restriction. For example, if you decimate by shot point in conjunction with only location multiple of 5, then decimation would yield 101, 105, 110, etc.
- Start From - Select how to define the starting point from which to start the decimation. Read more.
Your choices are:
| First Valid Location |
Begins location selection with the first trace in the file that meets the Posting Decimation criteria. |
| Last Valid Location |
Begins location selection with the last trace in the file that meets the Posting Decimation criteria. |
| User Defined Location |
Enables you to enter a number for the starting location. |
- Location No. - If you selected to start from a user defined location, then you need to type a number into this field to define the starting location. For example, a reference of 101 would begin selection at trace/shotpoint/distance 101.
- ProductNameposts Posted Values (picks, etc.) and Survey Labels (shotpoint numbers, etc.) in reference to survey locations after it applies Posting Decimation.
Connecting line between two points
Define how 2D seismic lines display on a plot. You have the following options:
- - Click <Edit...> to open the Line Attributes dialog box, where you can control the line style, thickness, and color of 2D seismic lines on your plot.
- - Click <Edit...> to open the Font dialog box, where you can change the default font type, style, and size.
Location labels
The options in this section control the frequency and appearance of 2D survey labels posted on your map.
- If the options in this section appear dimmed, select the Content Control tab, in the Map Components section click <Edit...> to open the Plot: Map Components dialog box, and select the Posting Labels check box.
- Location Highlight Symbol Every – Type a value to control the symbol frequency of 2D survey labels on your map. Typically, you will want a symbol at each label location. For example, type 1 and ProductName will post a symbol for every survey label, or type 2 and ProductName will post a symbol for every second survey label.
- <Symbol> - Click to open the Symbol dialog box, where you can change the default symbol type. For example, you might select a unique symbol to help set survey annotations apart from data value postings.
- Location Name Label Every – Type a value to control the label frequency of the 2D survey on your map. For example, type 1 and ProductName will post a label for every survey point, or type 2 and ProductName will post a label for every second survey point. Typically, you will use a multiple of the symbol frequency.
- <Font> - Click this button next to theLabel Frequency field to open the Map Plot Item Annotations dialog box, where you can change the default font type, style, and size.
- Connecting Lines – These lines connect 2D location symbols on your map. Click <Attrib> to open the Line Attributes dialog box, where you can control the line style, thickness, and color of survey labels.
- <Font> - Click this button next to theLine Label field to open the Map Plot Item Annotations dialog box, where you can change the default font type, style, and size of line labels.
- The options you set in the Set Location Decimation Parameters... section controls which locations are available for survey labels.
Data labels
The options in this section control the frequency and appearance of 2D data values posted on your map, including horizon picks, amplitudes, isochrons, and other calculated horizons.
- If the options in this section appear dimmed, select the Content Control tab, in the Map Components section click<Edit..> to open the Plot: Map Components dialog box, and select thePosting Labels check box.
- Data Value Symbol Every – Type in a value to control the symbol frequency of 2D data values on your map. For example, type 1 andProductName will post a symbol for every data point, or type 2 and ProductName will post a symbol for every second data point, and so on.
- <Symbol> - Click to open the Symbol dialog box, where you change the default symbol type.
- Data Value Label Every – Type in a value to control the label frequency of 2D data values on your map. For example, type 1 and ProductName will post a label for every data point, or type 2 and ProductName will post a label for every second data point, and so on.
- <Font> - Click to open the Map Plot Item Annotations dialog box, where you can change the default font type, style, and size.
What do you want to do?