 View image
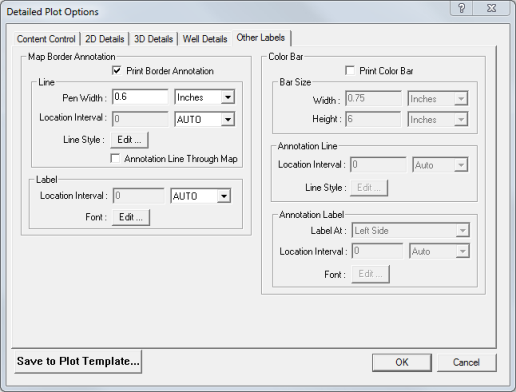
How to open the other labels tab
 to open the Print Map dialog box.
Use this section to control whether you want to plot a UTM grid on your map, as well as how you want ProductName to label the UTM grid.
Print Border Annotation – Select this check box if you want to plot a UTM grid on your map.
Pen Width – Type how wide you want to set the UTM annotation area around the perimeter of your map. Select from the list whether the value is in centimeters or inches.
Location Interval – From the list, select if you want to enter the line spacing in UTM, inches, or centimeters, and then type a value in the box. You can also select Auto to have ProductNameautomatically select the spacing.
Line Style: <Edit...> - Click to open the Line Attributes dialog box, where you can control the line style, thickness, and color.
Annotation Line Through Map – Select this check box if you want ProductName to draw UTM grid lines across your map in addition to annotating the perimeter. Clear this check box if you only want to annotate the perimeter.
Location Interval – To set the label spacing of the UTM grid lines, select from the list the same units you used for line location interval. Then in the box, type a value that is a multiple of the value you entered in the line location interval box.
Use this section to modify the appearance of a color palette on your plot.
Print Color Bar - Select this check box if you want to include a color palette on your plot.
Width - Enter the width of the color palette in inches or centimeters.
Height – Enter the height of the color palette in inches or centimeters.
Location Interval - Set the unit and value for line location intervals. You have the following choices:
| Option | Description |
|---|---|
| Auto | To set ProductName to automatically select the line spacing. |
| Units | To set the number of data units between lines. |
| Colors | To se the number of colors between lines. |
Line Style: <Edit> - Click to open the Line Attributes dialog box, where you can adjust the appearance of the lines.
Label At - Select to label the color on the left-hand side, right-hand side, or both sides, or to omit labels altogether.
Location Interval - From the list, choose the same units for annotation label as you chose for the annotation line, and set the Location Interval value to a multiple of the value you typed for annotation line.
<Font> - Click to open the Font dialog box, where you can set the font properties for the label.
ProductName organizes plot information to automatically create plot labels.
What do you want to do?