When you have a horizon posted, you can apply DGI contouring to it. From the
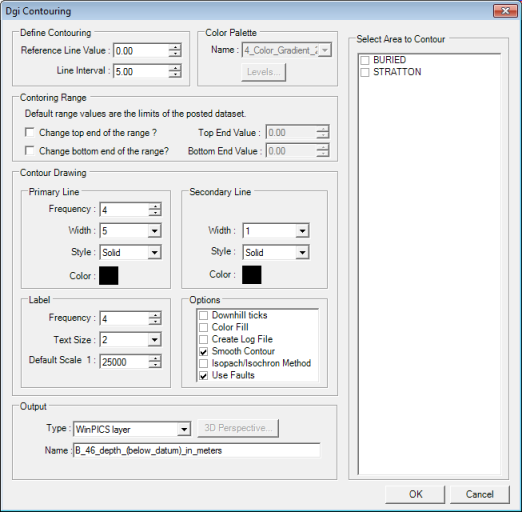
bar, select  to open the DGI Contouring dialog box. This dialog box has the following options:
 Define contouring
Reference Line Value - The first value in the data range from which the contour lines will be evenly distributed along.- Line Interval - The value assigned to distribute contours along the data range beginning at the Reference Line Value.
Color palette
- Name - Select a palette from the drop down list to display Color
Fill contours.
Contouring range
By default, ProductName uses the full range of values in your data. However, you can narrow this range by changing the maximum and minimum values.
- - Select this check box to change the maximum value for the contour lines. Any values higher than this value will be excluded from the contour.
- - Select this check box to change the minimum value for the contour lines. Any values lower than this value will be excluded from the contour.
- The top and bottom values match the values displayed in the color bar.
Contour drawing
Use this section to set attributes for your contours. You have the following options:
Primary Line
- Frequency - The frequency value corresponds to the interval selected, to determine how often the bold (secondary) contour will be displayed.
- Width - The width value determines the thickness in pixels to display the contour line.
- Style - Set if the line appears solid, dashed, etc.
- Color - Click this box to open the Color dialog box, where you can set the line's color.
Secondary Line
- Width - The width value determines the thickness in pixels to display the contour line when the line appears bold. As well, you can set the line's Style and Color options using the same instructions as Line Width.
Label
- Frequency - The frequency value corresponds to the interval selected, to determine how often the contour label will be displayed.
- Text Size - The text size value corresponds to the text on the contour lable.
- Default Scale - The default scale value increases or decreases by intervals of 5000 or you can type in a custom value. It determines the scale that your contour label will use in the map.
Options
Select how to display
your contour layer. See examples
Display Examples
The following images show examples of contours:
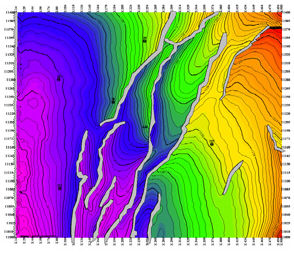
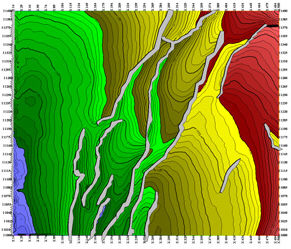
Examples: Start Val=1060, Interval=1, Bold Frequency=5, Label Frequency=5.
ProductNamewill place markers beginning at 1060 with a thin contour at 1060, thick contour on 1065, and a label on each thick contour beginning at 1065.
- To turn off the currently posted contour layer select
 from the menu bar.
- Each Contour layer created is saved to the Contour group in
the Layer
Manager bar. To a delete a contour layer, right-click on the
layer and select . The contour layer files will be removed from the project. To rename a contour layer, double left-click on the file name. View image
3D Volumes to contour
- Volumes
to Contour - List of data to contour. This window lists 3Ds or grids, depending what you have posted on your map. To choose a volume, select its check box.
Output
- Type - Use this option to create Smooth and Color Fill contour layers.
- Name - This is the name that ProductName saves the contour file to. When you save a contour layer, ProductName adds it to the Contour group in the Object Manager bar. ProductName also automatically generates an ASCII file, and stores it in the contours folder of your project. Click here to learn more about naming conventions.