Open topic with navigation
Build a Plot Label
The plot label designer has a default label configuration that you can customize for your map or seismic plots. You can also build your own label from scratch, then save the new label as a template to use again for other plots and projects.
 View a sample of a plot label
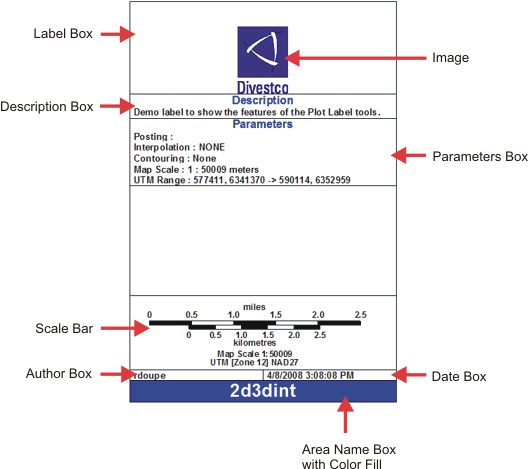
A plot label appears on every map or seismic plot. Click the <Preview> button on the Print to Windows Device dialog box to see a preview of how your plot label will look. A typical plot label will include the elements shown in the following image.
 How to open the plot label designer
The plot label designer gives you many ways to configure your plot labels. This workflow shows the steps to build a plot label using some typical label elements. Normally, you would use the default elements in the Label Box to construct your customized label. However, this workflow is intended to show you how labels are constructed by letting you build one from scratch.
For information on working in the label tree, and all of the options in the label designer, read more.
steps to create a label
Let's build a new customized label and save it as a template.
First, we'll delete all of the default label elements except the plot label.
- For each element in the label tree except the Plot Label, right-click the element and select from the shortcut menu. When you are finished, the Label Box will look like this.
 View image

- Normally, you would use the default elements in the Label Box to construct your customized label. However, this workflow is intended to show you how labels are constructed by letting you build one from scratch.
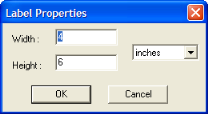
- Right-click on the Plot Label element and select from the menu. In the Label Properties dialog box, make sure the Width is set to 4, the Height is set to 6, and the unit is inches. This means the label will be 4 inches wide by 6 inches tall.
 View image
Now we need a box so we can add some content to the label.
- Right-click on the Plot Label element and select .
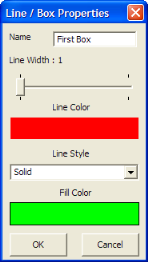
- In the Line/Box Properties dialog box, type First Box for the name, set the line color to red, select for the line style, and set the fill color to green.
 View image
- Click <OK>. The Label Box should show a new First Box element under the plot label.
 View image

Let's see how our new label looks in a plot so far.
- Click <OK> to close the Display Options dialog box.
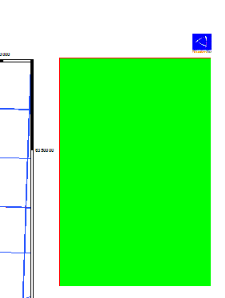
- In the Print to Windows Device dialog box, click <Preview>. WinPICS opens the Print Layout window, where you can scroll to view your label.
 View image
- If the printer you have selected in the Print Device field of the Print to Windows Device dialog box is not capable of handling a plot of this size, WinPICS will display a warning dialog. In order to preview your entire plot, you must change the printer in the Print Device field to one that can handle large plots.
The preview shows our label with only a single box and no content. Let's add some text to the box.
- Back in the Label Box of the Display Options dialog box, right-click the First Box element and select from the shortcut menu. The User Text dialog box opens.
- In the Description field type First Text.
- In the Label Text field type some text that you want in the top box of your label.
- Select Center for the justification. The User Text dialog box should look like this:
 View image
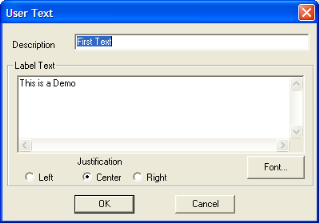
- Click the <Font> button to open the Font dialog box, where you can select a font, style, size, and color for your text.
- Click <OK> to close the Font dialog box.
- Click <OK> to close the User Text dialog box.
Now that you have a start on your new label, you should save it to a template so you can return to this point if you need to.
- In the Display Options dialog box, click <Save to Template> to open the Save As dialog box.
- Name your template and save it. As you build your plot label, you should periodically save it and overwrite the template. Later, you can use this template for other plots.
We need to add another box to the label.
- Open the Display Options dialog box again.
- In the Label Box, right-click the Plot Label and select . Name this box Second Box and choose settings as described when you built the first box. The label tree now displays the Second Box element.
 View image

Now let's associate a plot attribute with the second box by adding a plot parameter.
- Right-click Second Box and select from the shortcut menu. The Parameter Properties dialog box opens.
 View image
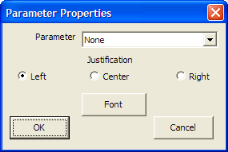
- From the Parameter list, select . This means the name for this plot (area name in the case of a map plot, line name in the case of a seismic plot) will display in the second box of the label. For a complete list of plot parameters you can include in your label, read more.
- Set the justification to Center.
- Click <Font> to open the Font dialog box.
- Our box fill is blue, and we want to make sure we will be able to read the plot name easily in the box, so set the color to white, and the font size to 16.
- Click <OK> to close the Font dialog box.
- Click <OK> to close the Plot Parameters dialog box. WinPICS has added the Plot Name element to the plot label tree.
 View image

- Right-click the Plot Name and select from the shortcut menu.
- Preview the plot label again. You can see your plot name at the bottom of the label.
 View image
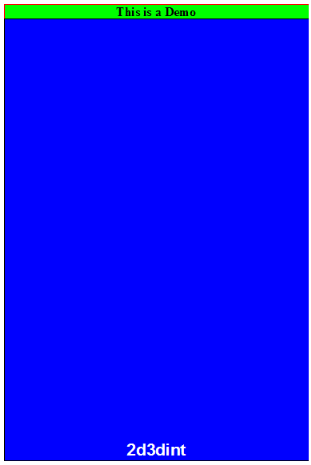
Let's add a box for the logo, and another box for label text.
- Follow the steps above to add a new box and call it Logo Box. Make the color fill white.
- Add another box and call it Middle Box. Make the color fill white. WinPICS adds the new boxes to the label tree.
 View image

We want the logo box at the top of the label, so we need to move it up. Right-click Logo Box and select from the shortcut menu.  View image

Let's add our company logo to the logo box.
- Right-click Logo Box and select from the shortcut menu to open the Label Image Properties dialog box.
 View image
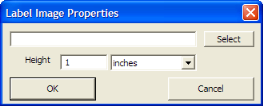
- Click <Select> and browse to find the image you want to use for a logo.
- Use the Height fields to customize the size of your logo.
- Click <OK> to close the Label Image Properties dialog box. In the label tree, you will see the logo under the Logo Box element.
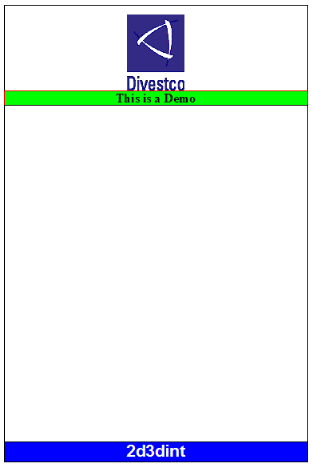
When you preview the label again, you will see the logo in the top box.  View image
Let's add a column to the label.
- In the label tree, right-click Plot Label and select from the shortcut menu. WinPICS adds an element called Columns to the label tree.
- Right-click the Columns element and select from the shortcut menu, to move Columns between Second Box and Middle Box.
 View image

- Bottom justify the Columns element.
We need to split our new column into two boxes.
- Right-click on Columns and select to open the Line/Box Properties dialog box.
- Name this box Left Box and give it a white fill.
- Repeat the step above to create a box called Right Box in the Columns element.
- Use the shortcut menu to bottom justify both boxes.
Now, we can assign plot parameters to the new column boxes.
- Right-click the Left Box and select from the shortcut menu.
- In the Parameter Properties dialog box, select from the parameters list, and select center justification.
- Click <OK>. You can see the new Author element under Left Box.
- Right-click the Right Box and select from the shortcut menu.
- Select from the parameters list, and select center justification.
- Click <OK>. You can see a Date/Time element under Right Box.
 View image

- In order to close off the columns, change the Middle Box to bottom justify.
- Preview the label to see the new columns filled with the author and data/time parameters.
 View image
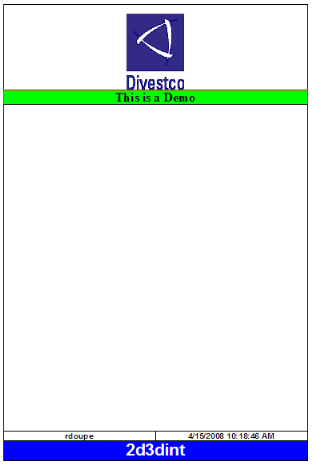
- Remember to click <Save to Template> every time you change your plot label. When you preview the label, make sure to select and select your template in the Print to Windows Device dialog box.
Lastly, we will add text to the Middle Box.
- Right-click the Middle Box element and select .
- In the User Text dialog box, type Title in the Description box, and type Plot Information in the Label Text box.
- Click <Font> and make the text Times New Roman, 16 point, and blue.
- Select the Center justification.
- Click <OK>. The label tree now displays the Title element under the Middle Box.
- Right-click Middle Box again and select .
- In the Parameter Properties dialog box, select Description from the Parameter list. This means you are going to fill the middle box with the text in the Plot Description box of the Print to Windows Device dialog box.
- Select a font and size.
- Center justify the Description parameter.
- Click <OK>. The label tree now displays the Description parameter under Title in the Middle Box.
 View image

- Click <Save to Template> and preview the label one last time.
 View image
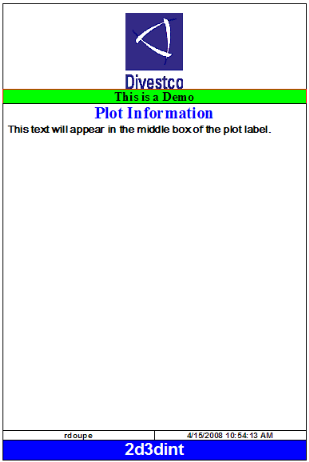
This workflow demonstrates how to build a very simple plot label. You can use the plot label designer to get as elaborate with your labels as you want. Save your label designs to templates and use them in many different plots.
What do you want to do?
 View a sample of a plot label
 How to open the plot label designer
 View image
 View image
 View image
 View image
 View image
 View image
 View image
 View image
 View image
 View image
 View image
 View image
 View image
 View image
 View image
 View image
 View image
 View image
 View image