Open topic with navigation
Seismic Plot Display Options for Seismic Display
 View image
How to open the seismic display tab
- On the menu bar, select or to open the Print to Windows Device dialog box.
- In the Display Options section, click <Edit> to open the Seismic Plot Display Options dialog box.
- Click on the Seismic Display tab.
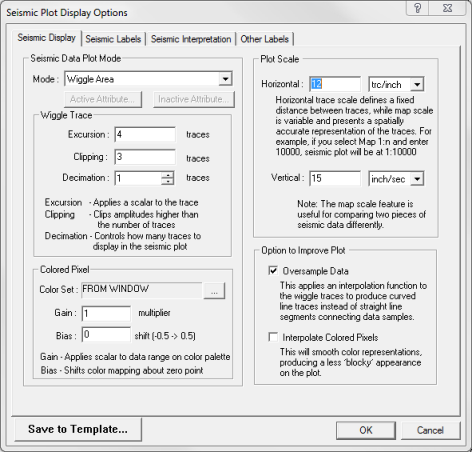
Use the Seismic Display tab to control the display scale, display mode, wiggle display, colored pixel display, and display interpolation.
This tab has the following options:
Seismic Data Plot Mode
Wiggle Trace
Define your wiggle trace display:
Colored Pixel
Set the color palette for your seismic data:
- - Select the color set for the seismic plot. The default color set in Scaled Windows Plot is the color set from current data display. In Scaled Template Plot, the default is the color set saved to the template. The ‘From Window’ setting uses the color set from the active seismic window. Click <Edit> to choose a saved color set.
- - Applies a scalar to your data range on the color palette so that colors will be focused on a smaller or larger data range than the default. If the data range on your color palette is –32 800 to +32 800, and you change the color gain from 1 to 2, then your new data range will be –16 400 to +16 400. All values greater than 16 400 will be displayed as 16 400.
- - Shifts the color mapping about the zero point. This is useful for ‘one sided data’ that contains all positive or negative values. Zero is the default and means that colors are distributed about the zero data value. Apply a color bias between –0.5 and +0.5 to shift the data range so that colors are distributed about a value other than zero. For example, if you have a color range of –32 800 to 32 800 and enter a color bias of ‘-0.5’, the new color range will be 0 to 65 500. A setting of ‘0.5’ would shift the color range to –65 500 to 0.
Plot Scale
Select a plot display scale:
-
- Enter a value in the in the Horizontal field and select traces/inch, traces/centimeter, or Map 1:n as the scale. Trace scales draw your seismic with a fixed distance between traces, while map scale is variable and presents a spatially accurate representation of the traces. For example, if you select Map 1:n and type 10000 in the Horizontal field, ProductName will print the seismic at 1:10000 map scale.
- The map scale feature is useful for comparing two pieces of data shot differently.
-
- Enter a vertical scale in inches/second or centimeters/second.
Option to Improve Plot
Select an interpolation option:
- - Over-sample data interpolation applies a function to the wiggle traces to produce curved line traces instead of straight line segments connecting data samples.
- - Smooths color representations, producing a less ‘blocky’ appearance on the plot.
What do you want to do?