Open topic with navigation
Seismic Plot Display Options for Seismic Labels
 View image
How to open the seismic labels tab
- On the menu bar, select or to open the Print to Windows Device dialog box.
- In the Display Options section, click <Edit> to open the Seismic Plot Display Options dialog box.
- Click on the Seismic Labels tab.
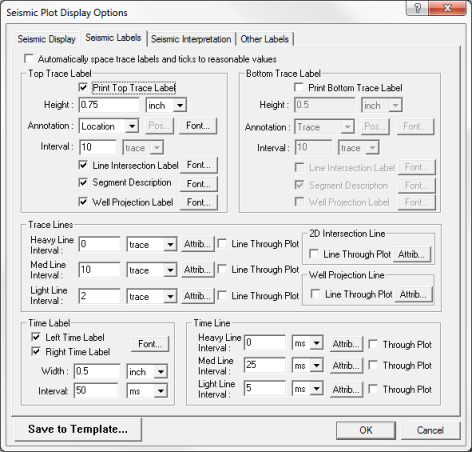
Use the Seismic Labels tab to control the labelling along the top and bottom of the seismic plot, and the frequency and appearance of the trace lines, time labels, and time lines.
This tab has the following options:
Top Trace Label
These labels appear along the top of the seismic display.
- – Select this check box to enable labeling along the top of the seismic plot.
- – This is the amount of space provided for labeling traces. If you are using a large font for labels, you will need to increase the height setting.
- – Choose whether to label traces with shotpoint location, UTM x- or y- location, trace, or header. If you select header, click on the <Pos> button. Click <Font> to change the default font, font style, or font size.
- – Controls the frequency of trace labeling. Select to label every x number of traces, centimeters, or inches on the seismic plot. If, for example, you set the label spacing to 10 traces, ProductName will label every tenth trace on the plot. (This is after decimation of traces for plot.)
- – Select this check box to draw line intersection labels on the seismic plot. Click <Font> to change the default font, font style, or font size.
- – Select this check box to add a description of the segment to the plot. Click <Font> to change the default font, font style, or font size.
- – Select this check box to draw well projection labels on the seismic plot. Click <Font> to change the default font, font style, or font size.
Bottom Trace Label
These labels appear along the bottom of the seismic display.
- – Select this check box to enable labeling along the bottom of the seismic plot.
- – This is the amount of space provided for labeling traces. If you are using a large font for labels, increase the height.
- – Choose whether to label traces with shotpoint location, UTM x- or y- location, trace, or header. If you select header, click on the <Pos> button. Click <Font> to change the default font, font style, or font size.
- – Controls the frequency of trace labeling. Select to label every x number of traces, centimeters, or inches on the seismic plot. If, for example, you set the label spacing to 10 traces, ProductName will label every tenth trace on the plot. (This is after decimation of traces for plot.)
- – Select this check box to draw line intersection labels on the seismic plot. Click <Font> to change the default font, font style, or font size.
- – Select this check box to add segment descriptions to the seismic plot. Click <Font> to change the default font, font style, or font size.
- – Select this check box to draw well projections labels on the seismic plot. Click <Font> to change the default font, font style, or font size.
Trace Lines
Defines the weight, frequency, and line attributes of the trace lines (also known as drop lines or dead trace overlays). These lines are drawn along the top of your seismic display at a regular interval.
Trace lines can be heavy, medium, or light. For each line weight, specify:
-
- Select if the trace interval is in or . Typically, you will use the same unit you used for Label Spacing in the Top Trace Label or Bottom Trace Label section.
-
<Attrib> - Click to configure the line attributes.
-
- Select these check boxes if you want to draw trace lines from the top to the bottom on the seismic plot. Clear these check boxes if you want to draw trace lines as tick marks.
Example: (using trace as frequency unit): Light Line Spacing = 2, Medium Line Spacing = 10, and Heavy Line Spacing = 100. Result: Light line on every other trace; Medium line on traces 10, 20, 30, etc.; Heavy line on traces 100, 200, 300, etc.
-
- Select this check box to draw 2D line intersection lines from the top to the bottom on the seismic plot. Click <Attrib> to change the default line style, thickness, and color.
-
- Select this check box to draw well projection lines from the top to the bottom on the seismic plot. Click <Attrib> to change the default line style, thickness, and color.
Time Labels
Place time labels on your seismic display.
- – Select this check box to place time labels on the left-hand side of your seismic plot.
- – Select this check box to place time labels on the right-hand side of your seismic plot.
- – This is the amount of space provided for labeling time lines. If you are using a large font for labels, or have long horizon names, increase the width.
- – Labels can be placed every x number of milliseconds or microseconds. For example, a label spacing of ‘500 ms’ results in a label every half second. You will probably want to use the same unit as you used for time lines.
- – Click <Font> to change the default font, font style, and font size of your time labels.
Time Lines
Edit these parameters to define the weight, frequency, and line attributes of the time reference lines.
- - The weight of the time lines can be heavy, medium, or light. You can place them at every x number of milliseconds or microseconds. You will probably want to use the same unit as you used for Intervale in the Time Labels section.
- <Attrib> - Click to change the default line style, thickness, and color.
- - Select these check boxes to draw trace lines from the top to the bottom on the seismic plot.
Example: (using milliseconds as frequency unit): Light Line Interval = 10, Medium Line Interval = 100, and Heavy Line Interval = 1000. Result: Light line every ten milliseconds; Medium line every tenth of a second; Heavy line every second.
What do you want to do?