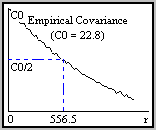
Empirical covariance is the covariance (‘cross-correlation function that is not normalized’) computed from measurements.
The empirical covariance plot will look something like this:

The empirical covariance plot is a plot of correlation (CO) versus distance (r). If the half-correlation point (CO/2) is well to the left of the center of the diagram, the data correlation over distance is low. This indicates that interpolation in zones with few input data points may be poor. Generally, the further the half-correlation point lies to the right, the higher the data correlation to distance is and the better your grid interpolation results will be.
The covariance can be used as a guideline in deciding how large a margin to use when incorporating data outside your gridding area in your gridding calculations. When you compute empirical covariance, the resulting value is automatically inserted for margin distance. In the Kriging gridding method, the half-correlation length is also inserted automatically when you compute empirical covariance.
Variogram characterizes the spatial continuity of a value.
What do you want to do?